Monitoring and allocating system memory is one of the primary things that an application developer has to deal with on Kubernetes. It turns out that this is a much more complicated affair than simply reading a number from the task manager. “How much memory do I have?”, “Who is using how much memory?”, “How much memory do my applications need?”. Those are the typical questions that we ask when it comes to investigating memory shortages. Answering them correctly takes some understanding of the operating environment that the executable runs in. This blog post is a collection of my personal notes on the Linux memory subsystem and Kubernetes internals relevant to the questions above.
Before we can measure how much memory our application needs, we must investigate how applications use memory and how memory is given out by the operating system.
The Virtual Memory System #
Kubernetes deployments usually run on Linux nodes and this blog post will focus exclusively on Linux environments. Linux, like most modern operating systems, uses a virtual memory system where applications are given memory in a virtual address space entirely divorced from the addresses in physical memory. Every application is given the impression that it is working with a large contiguous memory space, but really this virtual memory space is organized in separate blocks of around 4KB size, called pages, which are loaded into physical memory on demand. Whenever a process accesses a virtual address, the virtual address is translated to a physical address by the memory management unit (MMU) by looking up the associated physical location of the page in the page table. If a page is not already loaded into memory, a page fault interrupt is fired to transfer control back to the kernel, which will then load the page into physical memory. This mechanism also allows the operating system to give out more memory than is physically available, by retiring (swapping) pages that haven’t been used for a longer time back to disk (swap space) in favor of loading more urgently needed pages into memory. This will work as long as not all pages are needed at the same time. We differentiate between dirty pages which have been written to and have not been saved anywhere on disk and clean pages,which have only been read. Clean pages are always instantly reclaimable (nothing will be lost if we just throw them away), whereas dirty pages need to be written to disk before they can be unloaded. Furthermore, pages can be shared between multiple reading processes. They are only physically copied when one of the processes starts writing to it (copy-on-write).
Overcommit #
The virtual memory space is only constrained by the number of addresses that fit into a pointer type. We may choose to allow applications only as much virtual memory allocation as we have physical memory or we can allow “overcommit” beyond the physical memory size, which is the default in Linux. Overcommit further complicates memory monitoring, as applications can allocate almost limitlessly and then crash when they attempt to use that memory.
“Can I disable overcommit? What is the point when I can never use the overcommitted memory anyway?” Theoretically yes, practically no. It is possible to configure overcommit using sysctl vm.overcommit_memory=<value> with <value> being one of:
0: Overcommit enabled with some automatically determined upper limit1: Unlimited overcommit - every virtual memory allocation will be successful2: Never overcommit - virtual memory requests will only be successful if there is actual physical memory to back it
However, there are a good reasons that overcommit is enabled by default (in Linux, not in Windows): Many Linux applications have the bad habit of allocating large swathes of virtual memory at program start, then never using any of it. Those applications will work fine with overcommit but fail to run without it. Even worse, this sort of thing is happening automatically for any process starting other processes: The canonical way to start a new process in Linux is to fork yourself and exec the desired binary. The issue with this is that fork will always create an exact copy of the parent process, including all of its virtual memory. In a virtual memory system with unlimited overcommit this is not a problem because unmodified memory pages are shared (copy-on-write). The virtual memory pages of the child process will be mapped to the same physical pages used by the parent process and not consume any additional physical memory. Nonetheless, the application comprised of its parent and child processes will suddenly consume twice the virtual memory! Imagine an application that uses 80% of available RAM without overcommit and then attempts to start bash. In the ensuing fork, the parent process will duplicate its virtual memory and crash because committed virtual memory size ran over the physical memory size, despite the fact that bash isn’t using any of that memory.
Page Cache #
Linux uses buffered I/O by default unless the application is configured to use Direct I/O. When file-backed data is read or written to, the pages in question are first placed into physical RAM, modified there and only later written back to disk, instead of streaming bytes from/to the hard drive directly. The application only reads/writes file pages in RAM, not hard drive pages. This mechanism is called the page cache. The page cache is not something that we usually think of when we think about the RAM usage of our application. This isn’t memory that we personally allocated, it is allocated transparently and automatically by the kernel without our involvement. As a cache, it is also to some degree optional. You don’t necessarily need page cache for the application to function but to some applications it can be very detrimental if not enough page cache is available. Other applications, like the database RocksDB, have their own caching arrangements and may in fact work better without it (using Direct I/O mode).
Memory used for page cache is included in some memory metrics and not others, leading to gross misinterpretation of memory usage if you are not aware of it. Lack of page cache can impact application performance without being visible in memory monitoring. In the context of Kubernetes, it is important to know that used page cache is always counted towards the cgroup memory limit, which implements the container memory limit. In practice this means that a container will reclaim page cache for anonymous memory allocations when it is near the cgroup memory limit, even though there is plenty of free memory on the machine that could have been used for caching.
NUMA Nodes #
Not all physical memory is made the same: When we’re talking about large server computers, many of them have a NUMA (non-uniform memory access) computer architecture with multiple physical CPUs and each CPU has its own memory bank with separate bus. Such a grouping of CPU, memory, busses, etc. is called a NUMA node/cell/zone. Each CPU has very fast access to the memory in its own NUMA zone, but can only access another zone with high latency. Thus it is not enough to look at the entire system’s memory as a single blob because you cannot access all of it with the same speed. We should avoid splitting a workload across multiple NUMA zones. Kubernetes has limited support for NUMA, but we will not dive into it further. Nonetheless, it is important to at least be aware of the existence of this problem, particularly when you’re self-hosting on baremetal.
Summarizing the Problems of Virtual Memory #
Why is this low-level stuff important when I just want to monitor my memory usage?
- The virtual address space is not limited by the size of physical memory. Allocatable virtual memory is essentially infinite.
- Since pages are loaded only on demand, a process may allocate far beyond the physically available memory, as long as it does not use it.
- A process may even use more than the physically available memory, as long as it does not use all the memory at the same time (currently unused pages will be swapped to disk).
- Multiple processes may share the same page in physical memory. This means that the sum of physically-mapped memory by all processes can be much larger than actual physical memory of the machine. Even if we find an accurate metric to measure the true “physically used” memory of one process, we cannot sum up this metric to get the total usage.
- Page cache occupies physical memory, but does not necessarily reduce available physical memory because the pages can be reclaimed.
- All file reads and writes (that are not direct I/O) go through the page cache. If you want to open a buffered file, you need at least enough space for one extra page.
- Not all memory may be accessed with the same speed on NUMA systems. Effectively, this fragments your memory space into separate pieces. Even if you still have enough memory overall, you may not have enough in a single zone to actually schedule your workload with acceptable performance.
As we can see, the virtual memory system makes it much more difficult to tell how much memory is truly “available” and who is “using” how much physical memory. We must understand virtual memory to interpret memory metrics correctly.
Page Reclaim #
Synchronous and Asynchronous Reclaim #
The page reclaim algorithm as a part of the virtual memory system is responsible for recycling pages that are no longer needed. Without it, the memory consumption would just grow forever. There are two types of reclaim: synchronous/direct reclaim and asynchronous reclaim. Both types execute the same kernel functions, only the point of time when they are run is different. Usually, requests for more memory pages (i.e. page faults) are satisfied immediately from a global pool of available pages. To keep the pool from shrinking too much, the kernel will keep track of how many available pages are left and call the reclaim algorithm in the background (asynchronous reclaim) if number of available pages drops below the permittable low watermark. This is called asynchronous reclaim because the reclaim algorithm is executed in the background and does not block new memory requests. If, for some reason, there are not enough pages available in the pool to satisfy a memory request, or a memory request would increase memory usage over the configured maximum, then the reclaim algorithm must be executed immediately and will block execution of the user application. The page fault cannot return before the reclaim algorithm has found enough pages to satisfy the memory request (if not enough memory could be reclaimed, an OOM error will occur). This is called the direct/synchronous reclaim. How does the reclaim algorithm decide how many pages to reclaim? The kernel will call the reclaim function with a “reclaim target” specifying how much memory the function should try to reclaim. This is often referred to as the “aggressiveness” or “reclaim pressure” and it depends on how much memory is needed to return to a “nice state”, i.e. how many pages are needed to fill the pool back above low watermark (in case of asynchronous reclaim) or how many pages are needed to satisfy the current memory request (in case of direct reclaim).
LRUVecs, Active and Inactive List #
Page reclaim in Linux is essentially a LRU cache algorithm where the elements that have not been used for the longest time are preferably evicted from the cache to make space for new elements. To that end, the kernel keeps lists of all claimed pages in a data structure called lruvec. Inside an lruvec structure there are separate lists for anonymous memory and file-backed memory and there are seperate lruvec instances per memory cgroup as well as per NUMA node. It would be very expensive to pedantically reorder the list with every memory access like a true LRU cache would do. Instead, the kernel mainly tries to categorize pages into “active” and “inactive” depending on whether the page was accessed “recently”. This is done by splitting the LRU list into an active list and an inactive list where each entry has a referenced flag. (The lists are also internally ordered, but not strictly by “last access time” and this ordering is not particularly important to us). In addition, there is an accessed flag in every page table entry (PTE) that gets set by the hardware when the corresponding page is accessed by the process (there is a page table per process). A page that is faulted in (typically) starts at the head of the inactive list. It can move backwards in the list when other pages are inserted ahead of it. Periodically, the reclaim algorithm will run and check if any PTE has accessed=1. If so, it will set referenced=1 in the lruvec and reset all the PTE accessed flags to 0. If a page has both lruvec.referenced=1 and PTE.accessed >= 1 then it may be promoted from the inactive list to the head of the active list. Analogously, pages can move back from active to inactive when they have not been accessed for two scan periods, but they will usually not move back immediately. The kernel is conservative here and tries to keep pages longer in active for efficiency reasons, only shrinking the active list if its size gets out of balance compared to the inactive list. The kernel wants to maintain a balance and always have some pages in the inactive list because the tail of the inactive list is where the kernel will look for pages that are eligible for writeback/reclaim. The algorithm for moving pages between the inactive and active LRU lists or to the head/tail within an LRU list is much more complicated but the key takeaway here is that a page must have been accessed at least once in two consecutive scan periods to be in the active list; if the second access doesn’t happen soon enough, then the lruvec.referenced flag is cleared and the page will stay in the inactive list. This means that the size of the active list is a rough measure of the amount of memory that is frequently in use and not just sitting around idle. We can use this fact to approximiate the working set size (more on that later).
For more info see here and here.
Workingset Refaults #
There is another important concept here called “workingset refault”. A refault occurs when a page that was present in the past had to be reclaimed and is then faulted in again a “short” time later. This is an indication of thrashing: the page was part of the real working set but was reclaimed anyhow. Of course, thrashing is unavoidable if we are trying to use more pages than we have physical RAM for, but there are unfortunate cases where this can happen despite having enough RAM for the entire working set. Let us consider the following scenario:
In the scenario, all pages of the old working set are currently in the active list where they are protected from eviction. Then we completely stop using them and load other pages instead. It takes some time for these now unused pages to be demoted from active to inactive list. Meanwhile, pages of the new working set are faulted in one after another and put on the inactive list. Remember that pages only move from inactive to active when they are accessed twice in consecutive scan periods. If the new working set faults in more pages than the inactive list has space for, then these pages will be evicted again before the second access can happen that would have promoted them to active! The problem only occurs because old pages are hogging all the space in the active list, preventing the inactive list from growing and thus not giving pages from the new working set enough time to be activated.
Aside: refault distance #
Observe that:
- When a page is faulted in, it is put at the head of the
inactivelist and moves all other pages by one slot towards the tail - When an inactive page is accessed a second time, it is promoted to the
activelist (it is “activated”). By removing this page from theinactivelist, all pages that were newer than it move one slot towards the tail.
Thus, moving a page by N slots towards the tail requires at least N accesses of inactive pages. The number of “moves” that occured between the time of eviction and refault of a page is called the “refault distance”. The refault distance tells us how much more space the
inactivelist would have had to have in order for the page to be promoted toactiveinstead of being evicted. If theactivelist was empty, then all its space would’ve been available for theinactivelist. Therefore, if refault distance is smaller than theactivelist, then the eviction/refault could’ve been avoided. In this case the kernel will optimistically move the refaulted page immediately to theactivelist instead of putting it on theinactivelist as usual, in order to prevent a second eviction/refault.In order to keep track of refaults, the kernel maintains a counter of evictions + activations (=
nonresident_age). Some entries previously belonging to evicted pages in theinactivelist will be turned into “shadow entries” that record thenonresident_ageat the time of eviction. Once the page is refaulted, the currentnonresident_agecan be compared to the shadow entry’s recordednonresident_ageto calculate the refault distance.See here.
- When a page is faulted in, it is put at the head of the
Why do we need to know about refaults? Because cgroups v2 provides refault metrics that can be helpful in examining the behaviour of reclaim but to interpret them correctly you need to understand the refault algorithm.
Anatomy of a linux process’ memory footprint #
The total committed memory of a linux process is made up as follows:
- Anonymous memory: a memory page that is not associated with a file on a file system. These memory pages come from expanding the program’s data segment with
brk()/sbrk(), allocating a shared data segment withmmap()andMAP_SHARED|MAP_ANONYMOUSflags, or allocating a private anonymous mapping withmmapandMAP_PRIVATE|MAP_ANONYMOUSflags, usually throughmalloc(which usesmmapinternally). In other words: Anonymous memory will be made up mostly of the heap for a majority of programs. - Page cache: a memory page that is associated with a file backed by a file on disk, in swap space or on a block device (see Linux kernel docs section 10.2). The page cache contains a variety of different subtypes of pages:
- Buffered files: As explained previously, all files on hard drive that are accessessed in buffered I/O mode will be cached in the page cache.
- Buffered block devices: Block devices are also buffered in the page cache.
- File mappings: Shared and private file mappings (allocated via
mmap()withoutMAP_ANONYMOUSflag). - Shared libraries: Dynamically linked libraries (like libc.so) that are shared between processes are obviously file mappings and thus reside in the page cache.
- tmpfs pages: tmpfs is a temporary file system that is used for shared memory IPC. Files inside a directory that mounts the tmpfs file system (usually
/run,/tmpand/dev/shm) exist only in the page cache (unless they have been swapped out into the swap partition). This makes tmpfs pages sort of an exception, since they are the only ones in the page cache that are not backed by the hard disk or a block device. - Swap cache: As explained earlier, anonymous pages and private file mappings (
mmap()withMAP_PRIVATEflag) can be swapped out to the disk. On their way there, they temporarily end up in the page cache as a sort of synchronization point for concurrent accesses. This avoids unnecessary disk reads during concurrent swap-ins/swap-outs because the page cache is always checked first before loading any file. The swap cache uses the same data structures as the page cache and its pages are only distinguished through a flag from other pages in the page cache, but conceptually it can be seen as seperate from the page cache since it fulfills a different purpose.
- Zswap: Zswap is a new two-tier swap system where swapped out pages are compressed and preferrably stored in-memory in the zswap area for faster accessess than disk swap, until this area fills up and they are finally swapped out to disk. Zswap uses memory both for the swapped user pages and for its internal datastructures. I’m not sure if this is typically counted towards page cache or not.
- Kernel memory: memory that is used for kernelspace data structures associated with the processes. Kernel memory is often not counted towards memory consumption of a userspace program.
- Kernel stack: Each userspace program has its own separate stack for execution of kernel function
- Page tables: Memory used for page tables of the virtual memory system
- Slab: Slab memory is bulk allocated memory used as a cache for reusable kernel objects. Some of the slab memory is usually reclaimable and this part is especially interesting because it can fill up like page cache (for example with unused dentries) and falsify the total memory usage, even though it is reclaimable if needed.
- Other
In addition, the process may have anonymous memory pages retired to the swap space. Used swap space occupies the hard disk and not RAM, but I will still count it towards the memory footprint here as swap space serves as an “extension” of RAM.
The command cat /proc/<pid>/maps can be used to quickly inspect memory mappings of a process.
Do containers share memory pages? #
As mentionied earlier, if the same file is accessed by two processes, the page that memory-maps this file will be shared between them (copy-on-write) and only occupy physical memory once. Since we’re talking about applications running in Kubernetes, it is natural to wonder if this is also the case for containerized applications. In any case, you will likely have daemon processes running directly on the host that are not containerized and thus you can’t ignore this phenomenon completely. It turns out that containers, too, will share pages under specific circumstances. Docker will use the overlayfs storage driver by default which maps each layer of the Docker image to a directory then used in the overlay filesystem. Containers that share layers (through a common base image for example) will therefore share directories and pages for those files among eachother (read more here and here). However, there are other storage drivers for Docker and other container runtimes than Docker altogether that can be configured in various ways and may behave differently. How can you check? Look at the /proc/<pid>/maps files of each container and compare the inode numbers of mapped files.
Which container owns shared memory? #
Having established that containers can indeed share memory, the obvious next question is who will be held accountable for it. In cgroups v2 the algorithm for this has been improved. Memory usage for a shared page is always charged to the container that first accessed it, until the page is evicted again (even if that cgroup has long since closed the file and isn’t even using it anymore). In other words: Whoever caused the page fault that loaded the page is “forever” responsible for it. In addition to the memory that is occupied, cgroups also keep track of disk IO resources used. Clearly, the loading/write-back of a page causes disk operations, too. In this case as well, whoever is responsible for the first writeback of a file-backed shared page will be charged with all shared page writebacks to that file. If the kernel later notices that another container is generating far more dirty page writebacks, it may also decide to change the “ownership” to this more active container.
Memory Metrics #
With such a complicated memory system it is no surprise that there are numerous different measures of memory usage. Here’s a non-exhaustive list of terms that you may encounter:
- VSZ (Virtual Set Size): Size of virtual memory allocated by the process. Includes, among other things, anonymous pages (both in RAM, in swap and allocated but never used), page cache, pages of memory mapped files and shared libraries (no matter if they have been loaded into RAM or not).
- RSS (Resident Set Size): Size of physical memory that the process accesses. Includes anonymous pages in RAM (but not those in swap or those that were never faulted in), page cache and pages from file mappings or shared libraries that are loaded in physical memory. Note that shared library pages are counted despite being used by multiple processes. Thus, adding the RSS of all processes would not equal the total used physical memory because some pages are counted more than once.
- PSS (Proportional Set Size): Similar to RSS, except that shared pages (mostly shared libraries) are counted proportionally. For example, if three processes share a page of the libc.so file, then this page would only count with 1/3 of its size to each of their respective PSS values.
- USS (Unique Set Size): Size of all non-shared pages in physical memory, in other words: RSS without shared pages (like shared libraries).
- WSS (Working Set Size): Size of physical memory that the application needs to “work correctly”. This is the memory measure we are most interested in, but there is no generally agreed upon exact definition what WSS means or how to compute it. Probably, the WSS is comprised of frequently accessed anonymous memory and page cache that the application needs to have in physical memory to function without thrashing. This is not a always black and white matter but sometimes a spectrum with some applications experiencing a graceful degredation when less memory is available. Due to demand paging (allocated but unused anonymous memory, page cache that is no longer needed, etc.), the measured memory usage is usually higher than is absolutely needed. On the other hand, an I/O intensive application that would benefit from lots of page cache could still run with less memory than is really needed without incurring an OOM. The real value for WSS is somewhere in between. We will see some approaches to approximate WSS later.
In general, the different memory measures can typically be ordered as such:
VSZ >= RSS >= PSS >= WSS >= USS
Determining the Working Set Size #
Now, how do we actually determine the working set size? There are three methods to do this that I know of. Method 1 relies on manual access tracking with the page_idle flags. Method 2 relies on the automatic memory access tracking of the reclaim algorithm with the active and inactive LRU lists that was explained earlier. Method 3 relies on the new pressure stall information of cgroups v2.
Method 1: Idle page tracking #
In the section about page reclaim it was explained how the reclaim algorithm uses accessed flags on the page table entries (PTE) to track which pages are accessed frequently. There is another such flag that we can use ourselves without interfering with the kernel’s reclaim algorithm: In the /sys/kernel/mm/page_idle/bitmap file you will find a readable and writeable bitmap where each bit corresponds to a page. The bit is automatically set whenever a page is accessed. We can set all of those bits to 0, wait some period of time and count how many bits are set to 1 to find which pages have been accessed. Bits that are still 0 correspond to idle pages that are not in the working set. Why would anyone do this? I suppose being able to reset the flags yourself, and varying the time period of checking them, gives you more control over the working set estimation. However, it is very doubtful whether this approach will be noticably better, especially considering that the kernel already does practically the same thing for you automatically!
Method 2: active and inactive lists of the reclaim algorithm #
Remember that the active list of the reclaim algorithm contains pages that were determined to be accessed “frequently”. Luckily for us, the /sys/fs/cgroup/{cgroup_name}/memory.stat file contains inactive_anon, active_anon, inactive_file, active_file, unevictable values measuring the sizes of the corresponding internal lists of the reclaim algorithm. We can add or substract those values from other metrics to approximate the true working set size and this is what the standard Kubernetes metric container_memory_working_set_bytes does: It substracts inactive_file from memory.current (which is roughly the RSS). Why only substract inactive_file and not inactive_anon? Because anonymous memory can only be reclaimed to swap space and Kubernetes nodes typically run without swap, thus anonymous memory can never be paged out no matter whether it is used or not –> we should include it in the WSS. This shows that an approximation of the working set size with help of the reclaim algorithm is less than ideal: if you’re using a newer kubernetes version with swap active, then the official container_memory_working_set_bytes metric will not work for you because you have to substract inactive_anon as well to arrive at a sensible result.
Method 3: pressure stall information #
Cgroups v2 introduced a new concept called “pressure stall information” (PSI). This is the definitive method to quantify resource shortages and in theory can be used to compute the working set size exactly without any knowledge on your side about different memory categories, reclaim algorithms and all that jazz. The downside is that using it for this purpose is a much more involved affair than simply summing up some statistic values.
A pressure stall occurs when the processor is not executing any useful application code. A few examples will illustrate the concept:
- CPU pressure: A task is waiting to be scheduled (it could have run into its cgroup CPU limit or there simply isn’t enough total CPU for all processes)
- Memory pressure: A task is waiting for a page to be loaded in, waiting for page reclaim to finish, waiting for the transparent hugepage daemon, etc.
- IO pressure: A task is waiting for an IO resource, like reading from disk or from a network device (the wait could be because the cgroup IO limit was reached or simply because the IO device is slow)
Memory pressure stalls are summarized in the /sys/fs/cgroup/{cgroup_name}/memory.pressure file, which looks like this:
some avg10=0.00 avg60=0.00 avg300=0.00 total=0
full avg10=0.00 avg60=0.00 avg300=0.00 total=0
where some shows the time that at least one task was blocked and full shows the time that all tasks in the cgroup were blocked.
We can use the PSI to measure the working set size by gradually decreasing the memory limit from a high starting point and observing how the memory pressure increases in response. Some workloads will have a sharp increase (perhaps ending in an OOM) while others slow down gradually. With this method we can also observe that the WSS is not always a precise value, but sometimes more like a range. Note that using PSI to its full potential (avoiding OOMs) requires having swap and utilizing the correct cgroup settings which are controlled through the Kubernetes container manifest memory.limit and memory.request (more on that later).
If you want to use PSI to compute the WSS of your application, you may be interested in kondense or the senpai tool made by facebook as well as this illuminating thread on Gitlab.
Metrics Sources in Kubernetes #
There are many different Kubernetes components that provide metrics of some kind. The most relevant to us are cAdvisor and the prometheus-node-exporter. The cAdvisor is a Google project for collecting metrics of containers. The prometheus-node-exporter on the other hand collects resource usage metrics for the entire host system. Actually, cAdvisor can also be used to monitor memory at the “node level” through hierarchical accounting by looking at the root cgroup. However, we have seen that memory metrics are anything but trivial and this leaves a lot of room for confusion or interpretation, especially when not all cgroup metrics are available at the root cgroup, possibly requiring special logic to replace them. Prometheus-node-exporter on the other hand is as close to the metal as you can get. It’s easier to understand and debug. Furthermore, prometheus-node-exporter provides additional metrics that are not currently exported by cAdvisor (although they exist in the cgroup files).
For a more in depth look at the different metrics components see this excellent but slightly outdated article.
cgroup interface metrics #
The cAdvisor sources all of its memory metrics from the cgroup interface files (memory.current, memory.peak, memory.stat, etc.) so it’s worth exploring the contents of those files (in cgroups v2) in more detail (uninteresting values have been omitted):
memory.current: Total amount of memory used by this cgroup and its descendents. Includes anonymous memory, file-backed memory (page cache), kernel datastructures such as inodes and network buffers. (Probably doesn’t include swap space since that has its own separate metric).memory.peak: Maximum recordedmemory.currentfor this cgroup and its descendantsmemory.stat:anon: Amount of anonymous memorymemory.stat:file: Amount of memory used to cache filesystem data (i.e. page cache) including tmpfs and shared memorymemory.stat:file_mapped: Cached filesystem data that was loaded withmmap(). This should be a subset ofmemory.stat:fileincluding only actual files from disk (such as shared libraries), not tmpfs and similar stuff.memory.stat:file_dirty: Cached filesystem data that was modified but has not yet been written back to diskmemory.stat:file_writeback: Cached filesystem data that was modified and is currently being written back to disk
memory.stat:shmem: Amount of cached filesystem data that is swap-backed, such as tmpfs, shm segments, shared anonymous mappings. In a previous section we counted this technically towards page cache but importantly this memory cannot be reclaimed if swap is disabled, in contrast to the rest of page cache.memory.stat:swapcached: Amount of swap cache in memory. The swapcache is accounted against both memory and swap usage.
memory.stat:kernel: Amount of total kernel memory, including (kernel_stack, pagetables, percpu, vmalloc, slab) in addition to other kernel memory use cases.memory.stat:pagetables: Amount of memory allocated for page tablesmemory.stat:slab: Amount of memory used for storing in-kernel data structuresmemory.stat:slab_reclaimable: Part of “slab” that might be reclaimed, such as dentries and inodes. This metric is particularly interesting because it can fill up (with unused dentries for example) and is typically the reason when kernel memory usage becomes significantly largememory.stat:slab_unreclaimable: Part of “slab” that cannot be reclaimed on memory pressure.
memory.stat:active_anon: Anonymous memory pages and swap cache pages that are considered “active” by the reclaim algorithmmemory.stat:inactive_anon: Anonymous memory pages and swap cache pages that are considered “inactive” by the reclaim algorithmmemory.stat:active_file: File-backed memory pages that are considered “active” by the reclaim algorithmmemory.stat:inactive_file: File-backed memory pages that are considered “inactive” by the reclaim algorithmmemory.stat:unevictable: Memory pages that are considered unreclaimable by the reclaim algorithmmemory.stat:pgmajfault: Increasing counter of major page faults (a page had to be loaded from disk to be faulted in)memory.stat:workingset_refault_anon/_file: Counter for refaults of anonymous/file pages. Incremented whenever an anonymous/file page is faulted in that the kernel knows had been reclaimed only a short time before (see section on working set refaults). An increase of this counter indicates that pages of the true working set are being reclaimedmemory.stat:workingset_activate_anon/_file: Counter for refaults of anonymous/file pages that are immediately promoted toactiveafter refault (because their refault distance was small enough). A temporarily faster increase of this counter indicates that the application is changing to a new working set. A prolonged faster rate of this counter indicates that the working set is close to or above memory capacity or the working set is constantly changing and thrashing may occur.memory.stat:workingset_restore_anon/_file: Counter for refaults of anonymous/file pages that were previously on theactivelist before being reclaimed. A fast increase of this counter is a strong indicator of thrashing.
memory.swap.current: Total amount of swap currently being used by the cgroup and its descendantsmemory.swap.peak: Maximum recordedmemory.swap.currentfor this cgroup and its descendantsmemory.pressure: Contains information about the amount of time that tasks were delayed due to memory pressure stalls (see previous section)
On NUMA systems, many of the metrics in memory.stat also exist in memory.numa_stat separately counted per NUMA node.
When reading older documentation or online discussions you will often still come across old terms from cgroups v1. Therefore, let me also explain a few cgroup v1 metric values and particularly how they differ from the newer metrics that replace them:
memory.usage_in_bytes: This is roughlymemory.stat:rss+memory.stat:cache(+memory.stat:swap), but the value is only an approximation and can be a bit higher than actual usagememory.stat:cache: Amount of page cache memory (unsure if this includes swap cache or not)memory.stat:rss: Anonymous memory + swap cache. THIS IS NOT RSS despite its name. Be cautious because many people will say “rss” and really mean this metric and not the true resident set size which would also include file-backed page cache. The actual RSS can be computed asmemory.stat:rss + memory.stat.mapped_filememory.stat:mapped_file: Mapped file pages including tmpfs and shmem. Analogous tomemory.stat:filein cgroups v2.
The most important difference is that all of the above metric values in cgroups v1 exclusively measure processes belonging directly to this cgroup, not to child cgroups! The metric values of cgroups v2 on the other hand are always hierarchical and aggregate metrics from their descendants. This means that the metric values of v1 and v2 are only comparable if there are no descendant cgroups in the tree. Most of the cgroup v1 metrics also have versions with a total_ prefix (total_cache, total_rss, total_mapped_file, total_active_anon, etc) that do aggregate descendants similarly to cgroups v2.
cAdvisor metrics #
Unfortunately, not all cgroup metrics are exported by cAdvisor and even less are properly documented. Here’s all the metrics that I could confirm to exist in the cAdvisor source code:
| cAdvisor Metric | Metric Source | Comment |
|---|---|---|
container_memory_cache | v1: memory.stat:total_cachev2: memory.stat:file | Usage of file-backed memory like page cache. |
container_memory_rss | v1: memory.stat:total_rssv2: memory.stat:anon | Usage of anonymous memory (+ swap cache in v1). NOT THE TRUE RESIDENT SET SIZE. |
container_memory_kernel_usage | v1: memory.kmem.usage_in_bytesv2: ??? perhaps memory.stat:kernel | Memory used by kernel data structures. Couldn’t find any place in the libcontainer implementation that actually sets this value for cgroups v2. |
container_memory_mapped_file | v1: memory.stat:total_mapped_filev2: memory.stat:file_mapped | Cached filesystem data that was loaded with mmap() (excludes tmpfs, shmem, etc.) |
container_memory_swap | v1: memory.stat:total_swapv2: memory.swap.currentv2 rootcg: /proc/meminfo:SwapTotal - /proc/meminfo:SwapFree | Usage of swap space. Note that for the root cgroup the value is computed differently because the memory.swap.current does not exist for the root cgroup. |
container_memory_failcnt | v1: memory.failcntv2: seems to be unset | Counter of times that the cgroup has hit its memory limit |
container_memory_usage_bytes | v1: memory.usage_in_bytesv2: memory.currentv2 rootcg: memory.stat:anon + memory.stat:file | Overall memory usage including page cache and kernel data structures. Note that for the root cgroup the value is computed differently because the memory.current does not exist for the root cgroup. |
container_memory_max_usage_bytes | v1: memory.max_usage_in_bytesv2: memory.peak | Maximum overall memory usage |
container_memory_working_set_bytes | v1: memory.usage_in_bytes - memory.stat:total_inactive_filev2: memory.current - memory.stat:inactive_file | Rough approximation of the working set (see section on determining the true WSS) |
container_memory_total_active_file_bytes | v1: memory.stat:total_active_filev2: memory.stat:active_file | Amount of memory on the reclaim algorithms active_file list |
container_memory_total_inactive_file_bytes | v1: memory.stat:total_inactive_filev2: memory.stat:inactive_file | Amount of memory on the reclaim algorithms inactive_file list |
container_memory_failures_total{failure_type="pgfault"}container_memory_failures_total{failure_type="pgmajfault"} | Counter of page faults (minor + major) and counter of only major page faults. A minor page fault occurs when a page is accessed which is already present in memory but for which no page table entry exists (for this process). A major page fault occurs when a page has to be loaded from disk into memory. For each failure_type tag there are actually two separate metric with the tag scope="container" or `scope=”hierarchy” being published. It appears that the same value as always assigned to both of them (perhaps a historical wart from the time of cgroup v1 with hierarchical accounting disabled). |
Prometheus node exporter metrics #
The prometheus-node-exporter parses the /proc/meminfo file and exports its metrics unchanged, e.g. the Active(file) in /proc/meminfo metric corresponds to node_memory_Active_file_bytes in Prometheus. The meaning of each metric is well documented so we don’t have to repeat them here.
There is no working set metric in /proc/meminfo, but if we want a comparable host-level metric to the one exported by cAdvisor, we can calculate it as follows:
working_set = node_memory_MemTotal_bytes
        - node_memory_MemFree_bytes
        - node_memory_Inactive_file_bytes
Kubernetes memory requests and limits #
The memory request and memory limit values in the container manifest are how we allocate memory to our workloads. They are used on two levels: The Kubernetes conrol plane uses them to decide what pods should run on which node (scheduling/eviction) and the operating system uses them to enforce fair resource sharing (through cgroups on Linux).
Depending on the relation between the request value and limit value, each workload is assigned a quality-of-service (QoS) class:
- Guaranteed: Every container in the pod must have memory request == memory limit and cpu request == cpu limit.
- Burstable: At least one container in the pod has a memory or cpu request/limit.
- Best-Effort: None of the containers have a memory or cpu request/limit
The QoS class is a pod-level property because that is the schedulable unit, even though request and limit values are set on container level. It determines in what order pods will be evicted if kube-scheduler determines that the node is running out of resources (i.e. memory). Pods with a lower QoS class are evicted first. Note that scheduling and eviciton are entirely controlled by Kubernetes and have nothing to do with Linux/cgroups. However, the QoS class also influences how Kubernetes sets cgroup settings and thus the behaviour of the cgroups v2 memory controller.
How do cgroups enforce memory request and limit? #
The effects of memory requests and limits set in the container manifest differ significantly depending on whether the node’s operating system is using cgroups v1 or cgroups v2. Nowadays, we can assume to be running with cgroups v2. Prior to the introduction of cgroups v2, the memory request was used exclusively by kube-scheduler to determine how many pods can be packed into a node’s available memory. With cgroups v1, a pod could only be 100% sure to use all of its memory request without OOM killing under very specific circumstances:
- Node allocatable memory (as far as kube-scheduler is concerned) must not be overcommitted. Otherwise, more pods could be scheduled than physical memory is available and they would not be able to all use their full memory request at the same time.
- Enough memory must be reserved for non-pod processes on the node. Otherwise, those processes could “steal” memory that was promised to scheduled pods.
- Every container in every pod must have memory request == limit. Otherwise, a pod may use more memory than was accounted for by kube-scheduler; using memory that was promised to another pod.
There is no technical mechanism in cgroups v1 to guarantee the container a minimum amount of memory. Only the maximum memory amount (memory.limit_in_bytes) is enforced. Starting with cgroups v2, the situation has changed. We now have four knobs in the cgroup interface to tune its behaviour:
- memory.min: Set to the Kubernetes memory request. This is the minimum amount of memory that you’re technically guaranteed to get. Even if nothing else on the system can be reclaimed in a low-memory situation, the kernel will not try to reclaim your
memory.minfrom you. Of course, if push comes to shove, the system-wide OOM killer will be invoked and you’re not safe from that. - memory.low: Unused in Kubernetes. The low watermark is a soft promise: When the kernel tries to reclaim pages (for a parent cgroup) it will ignore cgroups that are below the low watermark in its first pass. Only if the kernel fails to reclaim enough memory in the first pass from other offending cgroups, it will start a second pass that can also reclaim from cgroups that are still below the low watermark. The
memory.lowsetting has one other effect: It scales the “reclaim pressure” by proportioning the current usage compared to thememory.lowvalue. You are excused for all memory usage below the low watermark, so if you are only using slightly more, then the kernel will try to reclaim less pages from you than from another cgroup that is significantly over its allotedmemory.low. memory.high: Set to approximately 0.8 * Kubernetes memory limit, unless limit == request, then the setting will remain unused. This is a soft upper limit, meant to “throttle” the applications memory usage. How do you “throttle memory”? The idea is to gradually degrade performance of the cgroup without outright killing it, by forcing it to rid itself of other pages before it gets any more. Some applications can actually permanently reduce their memory usage in this way because they have pages loaded that they don’t access anymore (for example, some memory that was only used during application startup). Others who acess all their memory will grind to a halt due to thrashing but this is in fact a desired behaviour since most applications increase their memory usage slowly and this thrashing will be visible in the pressure stall information, giving an admin enough time to react (increase memory.high or scale out horizontally) before it comes to an OOM kill.
According to official documentation, going over
memory.high“puts the cgroup under heavy reclaim pressure” but it is never explained what exactly this means. From what I can tell, any memory allocation above the high watermark will synchronously execute a “direct reclaim” and try to free enough pages to stay belowmemory.highbefore granting the memory allocation. Even if this reclaim fails, the OOM killer will not be invoked! The cgroup memory controller must begrudingly allow you to go over the high watermark.- memory.max: Set to the Kubernetes memory limit. This is the absolute maximum limit. If the cgroup crosses the max watermark with an allocation, the kernel will try to reclaim pages from the cgroup to go back under the limit, or if that fails, invoke the OOM killer to terminate a process inside the cgroup.
Does it make sense to use memory.high? #
A comment in the official kernel documentation tells us that we should really be using memory.low and memory.high as the main mechanism for controlling resource usage. Cgroups v2 was made to address the underutilization issues of a hard limit (memory.max/memory.limit_in_bytes) and this is the tool that they give us. The goal of memory.high is to soft-limit memory usage at the cost of performance by retiring pages to disk that are perhaps still in use (this slow-down would be gradual if memory usage only increases slowly and would be easily visible in the pressure stall info). The problem is that you have to be able to actually reclaim pages for this to work. The only types of reclaimable pages are anonymous memory pages (if there is enough swap space available) and page cache. Remember that we’re on Kubernetes which is typically running completely without swap. Swap support has only been released to beta a mere year ago (late 2023) and is still completely unsupported on the major cloud providers as far as I can tell. Since there is no swap, this only leaves page cache which the typical web application running on Kubernetes uses very little of. It seems that memory.high is pretty useless for us:
If no page cache or very little is used then almost nothing can be reclaimed. Ergo there would be no appreciable throttling: anonymous memory usage would continue to rise unimpeded* until memory.max is reached and the cgroup gets OOM killed. It is doubtful whether the small amount of reclaimed page cache would cause enough pressure stalling to trigger any resource alarms –> Using memory.high has no noticable effect.
(*) Even if there is nothing to reclaim, the direct reclaim algorithm should run every time a new page is requested and cause a pressure stall that gets recorded in the PSI, but requests for new anonymous pages are rare and therefore the performance impact will probably be too small to notice.
If a large amount of page cache is used, memory.max would reclaim it before invoking the OOM killer, giving us enough time to notice the page cache thrashing (before anonymous memory usage rises to memory.max) and thus fulfill the same role as memory.high.
Thus, it seems like a good idea to set the Kubernetes memory limit == request by default for workloads with a predictable memory usage to get into the “Guaranteed” QoS class. If you want to make use of the memory.high “throttling” behaviour, it probably makes sense to set the limit such that memory.high will be slightly above memory.min. Setting memory limit much higher than memory request can be useful for pods that have a memory burst on startup but can also be dangerous to rely on.
Node memory reserves and pod evictions #
Previous sections of this article have covered extensively how the Linux kernel manages memory, deals with memory shortages and enforces memory limits of containers, eventually ending in an OOM kill. However, we haven’t touched yet on the memory management of Kubernetes nodes, which happens at a higher level.
Kubernetes is essentially a scheduler that distributes workloads over many hosts. It has to decide on which host/node to put a pod to use available resources efficiently. To do this, it needs to know how much memory is available for pods and how much of that memory to account for a new pod. Not all of the memory that is currently free can be used for scheduling pods because there are other processes running “beyond the control” of the Kubernetes scheduler, yet competing for resources: operating system processes, Kubernetes control plane processes (not running as a pod) and certain user applications running directly on the host.
Depending on configuration, the kubelet can divide node memory capacity into four portions as shown below to ensure that each of the above process groups are guaranteed enough memory and do not impact the other groups by going over their reserved portion:
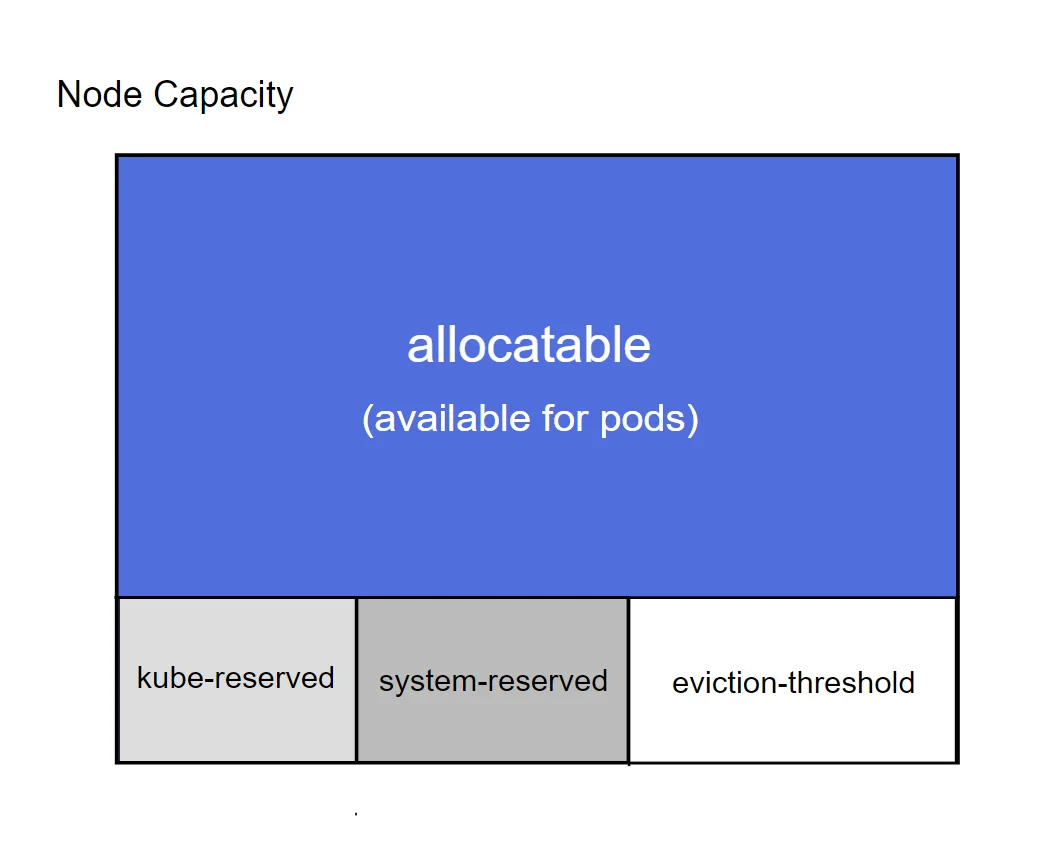
— Kubernetes node capacity divided among different process groups —
Here, “system-reserved” is a portion reserved for non-pod system and user processes, “kube-reserved” is a portion reserved for non-pod Kubernetes control plane processes such as the kubelet and “allocatable” is the portion that is available for scheduling pods (When scheduling a new pod, the kube-scheduler checks if there is enough “allocatable” memory to fit the memory request of the pods. In consequence, the sum of all pod memory requests will be less than “allocatable” but not necessarily the current usage). This leaves the “eviction-threshold” which is a buffer region allowing pods to go temporarily over the “allocatable” amount without immediately cutting into “kube-reserved” and “system-reserved”, which is needed for the eviction algorithm. The size of each portion is configured through command-line arguments or a config file when the kubelet starts. Example:
- A host has 8192 MiB capacity
- Configure pods to be evicted if available memory is less than 512MiB by setting
eviction.hard=memory.available<512Mi - Reserve 512 MiB for system processes with
system-reserved=memory=512Miand 1024 Mi for kubernetes processes withkube-reserved=memory=1024Mi - Allocatable memory is then
capacity - system-reserved - kube-reserved - eviction.hard: 8192 MiB - 512 MiB - 1024 Mib - 512 MiB = 6144 MiB available for scheduling pods
Now, the question that interests us is “how and when does Kubernetes enforce the node memory reserves?”. There are two mechanisms at play here, one completely controlled by the kubelet, acting at the pod level, and one based on the familiar cgroup construct, acting at the process level.
Pod evictions #
Pod evictions are the first line of defense against host-level OOM events. They are controlled by the kubelet process, which checks the total memory usage of all pods periodically, and then removes pods from the node if the eviction threshold was met. This eviction threshold can be configured with a kubelet option --eviction.hard=memory.available<512Mi. It is also possible to configure a grace period so that pods which go over the threshold only for a short time won’t be evicted immediately. In any case, the kubelet only checks memory usage once every few seconds; it cannot react instantly. This is why a buffer is needed, to account for the “overrun” until the kubelet has time to act with an eviction. Without this buffer/threshold, the eviction mechanism would be useless because a system OOM would occur immediately before an eviction can happen.
The fact that this pod eviction mechanism is handled by kubelet instead of the operating system is problematic because Kubernetes is quite abstracted from the operating system. A lot of nuance in the memory accounting is lost in that abstraction. Pods are evicted when the memory.available metric falls below the eviction threshold. To determine this metric the kubelet sums up the cAdvisor metric container_memory_working_set_bytes over all pods. Remember that this metric is defined as memory.current - memory.stat:inactive_file, ergo it will still include memory.stat:active_file and memory.stat:slab_reclaimable. Both active file pages and slab are reclaimable under memory pressure and serve as a cache. They remain present until there is pressure to reclaim them. In practice, this means that the kubelet will often think it’s running out of memory.available and start evicting pods prematurely, despite the fact that all this cache would become available immediately as needed. For example, a workload that continuously opens new files (like a database) and doesn’t have a set memory limit will have its cache grow unboundedly and inevitably cause pod evictions.
What can we do about it? We need to put memory pressure on pods that use a lot of page cache before memory.available becomes scarce. As always, the answer is cgroups: First and foremost, you should set sensible request and limit in the pod manifest. This ensures that the cgroup will stop any single container from growing too much. The request should account for all the memory needed, including indispensible cache. limit should not be too much higher than that. Of course, putting a hard limit on a container means that the container may reach its limit and will not be allowed to grow even if there is plenty of free RAM to go around. It would be more efficient to run without a per-container limit and let everyone use as much cache as is available. This requires some way to put memory pressure on all pods in aggregation and the next section will show how to do it.
Node Memory Limits #
To cooperatively share cache memory among all containers, we need to primarily rely on Linux memory pressure mechanisms to fairly distribute cache memory among the pods instead of manually assigning tight limits per individual container. We still need to limit the total memory used by all pods, so that they don’t interfere with more important system services. A hierarchical cgroup that is parent of all pods is required to aggregate their memory usage. If the cgroupsPerQOS option is set (default true as of v1.36), a cgroup hierarchy will be created and managed by the kubelet automatically. This hierarchy has a parent cgroup for all pods (/cgroup2/kubepods) and also for each QoS class (for example /cgroup2/kubepods/burstable). It appears to me that the kubelest will set memory.min options on those cgroups to the sum of all container’s memory requests (see KEP). It is unclear to me if it also sets memory.max or memory.high options and how this would interact with kubelet-controlled pod evictions. If the kubepods cgroup had a memory.max equal to allocatable, then there would be no use for pod evictions at all. Luckily, we do not necessarily need a memory.max cgroup limit on the the cgroup of all pods. Instead of setting a maximum on the pods, we can also set a minimum on the system services that we want to protect and exactly this is possible with another Kubernetes setting: enforce-node-allocatable=pods,system-reserved,kube-reserved will make kubelet manage the system-reserved and kube-reserved cgroups and set their respective memory.min cgroup settings, thus protecting them by forcing other processes into an OOM if their memory minimum is at risk. Note that system-reserved and kube-reserved are for processes that are not managed by kubelet and so kubelet cannot create their cgroups automatically. These cgroups must be created manually and then confiured with the Kubernetes options system-reserved-cgroup and kube-reserved-cgroup.
Since the memory-QoS feature in Kubernetes is still in alpha status as of v1.36, its implementation is changing rapidly. Some of the specific behaviors I have explained in this blog post may already be slightly outdated in a few months. Nevertheless, I hope that my blog post has helped you understand where the problems with memory management and monitoring lie and what options are available to address them.
Kommentare